January 18, 2021
Mathematical models explaining COVID-19 nonpharmaceutical control
Why is it crucial that as many people as possible reduce their contacts
Almost one year after the beginning of the COVID-19 pandemic, Germany is in its third lockdown, having emerged as an extension and tightening of the lockdown light measures introduced in November 2020. Many wonder about the efficacy and duration of the current stricter measures and we use here a simple mathematical model to illustrate that for the successful control of the pandemic it is important that as many people as possible reduce their contacts. To this end a simple mathematical model is used, assuming that only part of the population adheres to specified contact restrictions.
The simulations reported below show a fictitious situation, which, however, comes very close to the situation in Germany in early fall. We follow an ongoing COVID-19 wave under mild control measures for 10 weeks. The reproduction number for these mild control measures is 1.5, roughly the value reported by the Robert Koch Institute (RKI) for autumn 2020. Simulated restrictions are de facto reducing contacts so that from week 10 the dynamic should proceed under lower reproduction number. If everyone in the population adhered to these restrictions, they would in a reproduction number of 0.75, hence in exponentially decreasing cases. This is an idealized situation, as it is not realistic to assume that the whole population freezes down to the same contact reduction level, either due to personal choice or for major objective constraints (think for example of medical staff and other essential workers, who can be very cautious but cannot reduce contacts below a certain critical threshold and were already subject to strict safety measures before general contact reductions were introduced in autumn). We split the total population into a compliant group, which attains to the prescribed contact restrictions ("according to regulations"), and a non-compliant population that keeps the same behavior as before contact reduction. We show how the number of cases would develop if 5%, 30%, 50%, 80% or even 95% of the population adhered to the contact restrictions ("according to regulations"). The figures below show the different developments in the number of cases for 6 weeks after introduction of the measures.
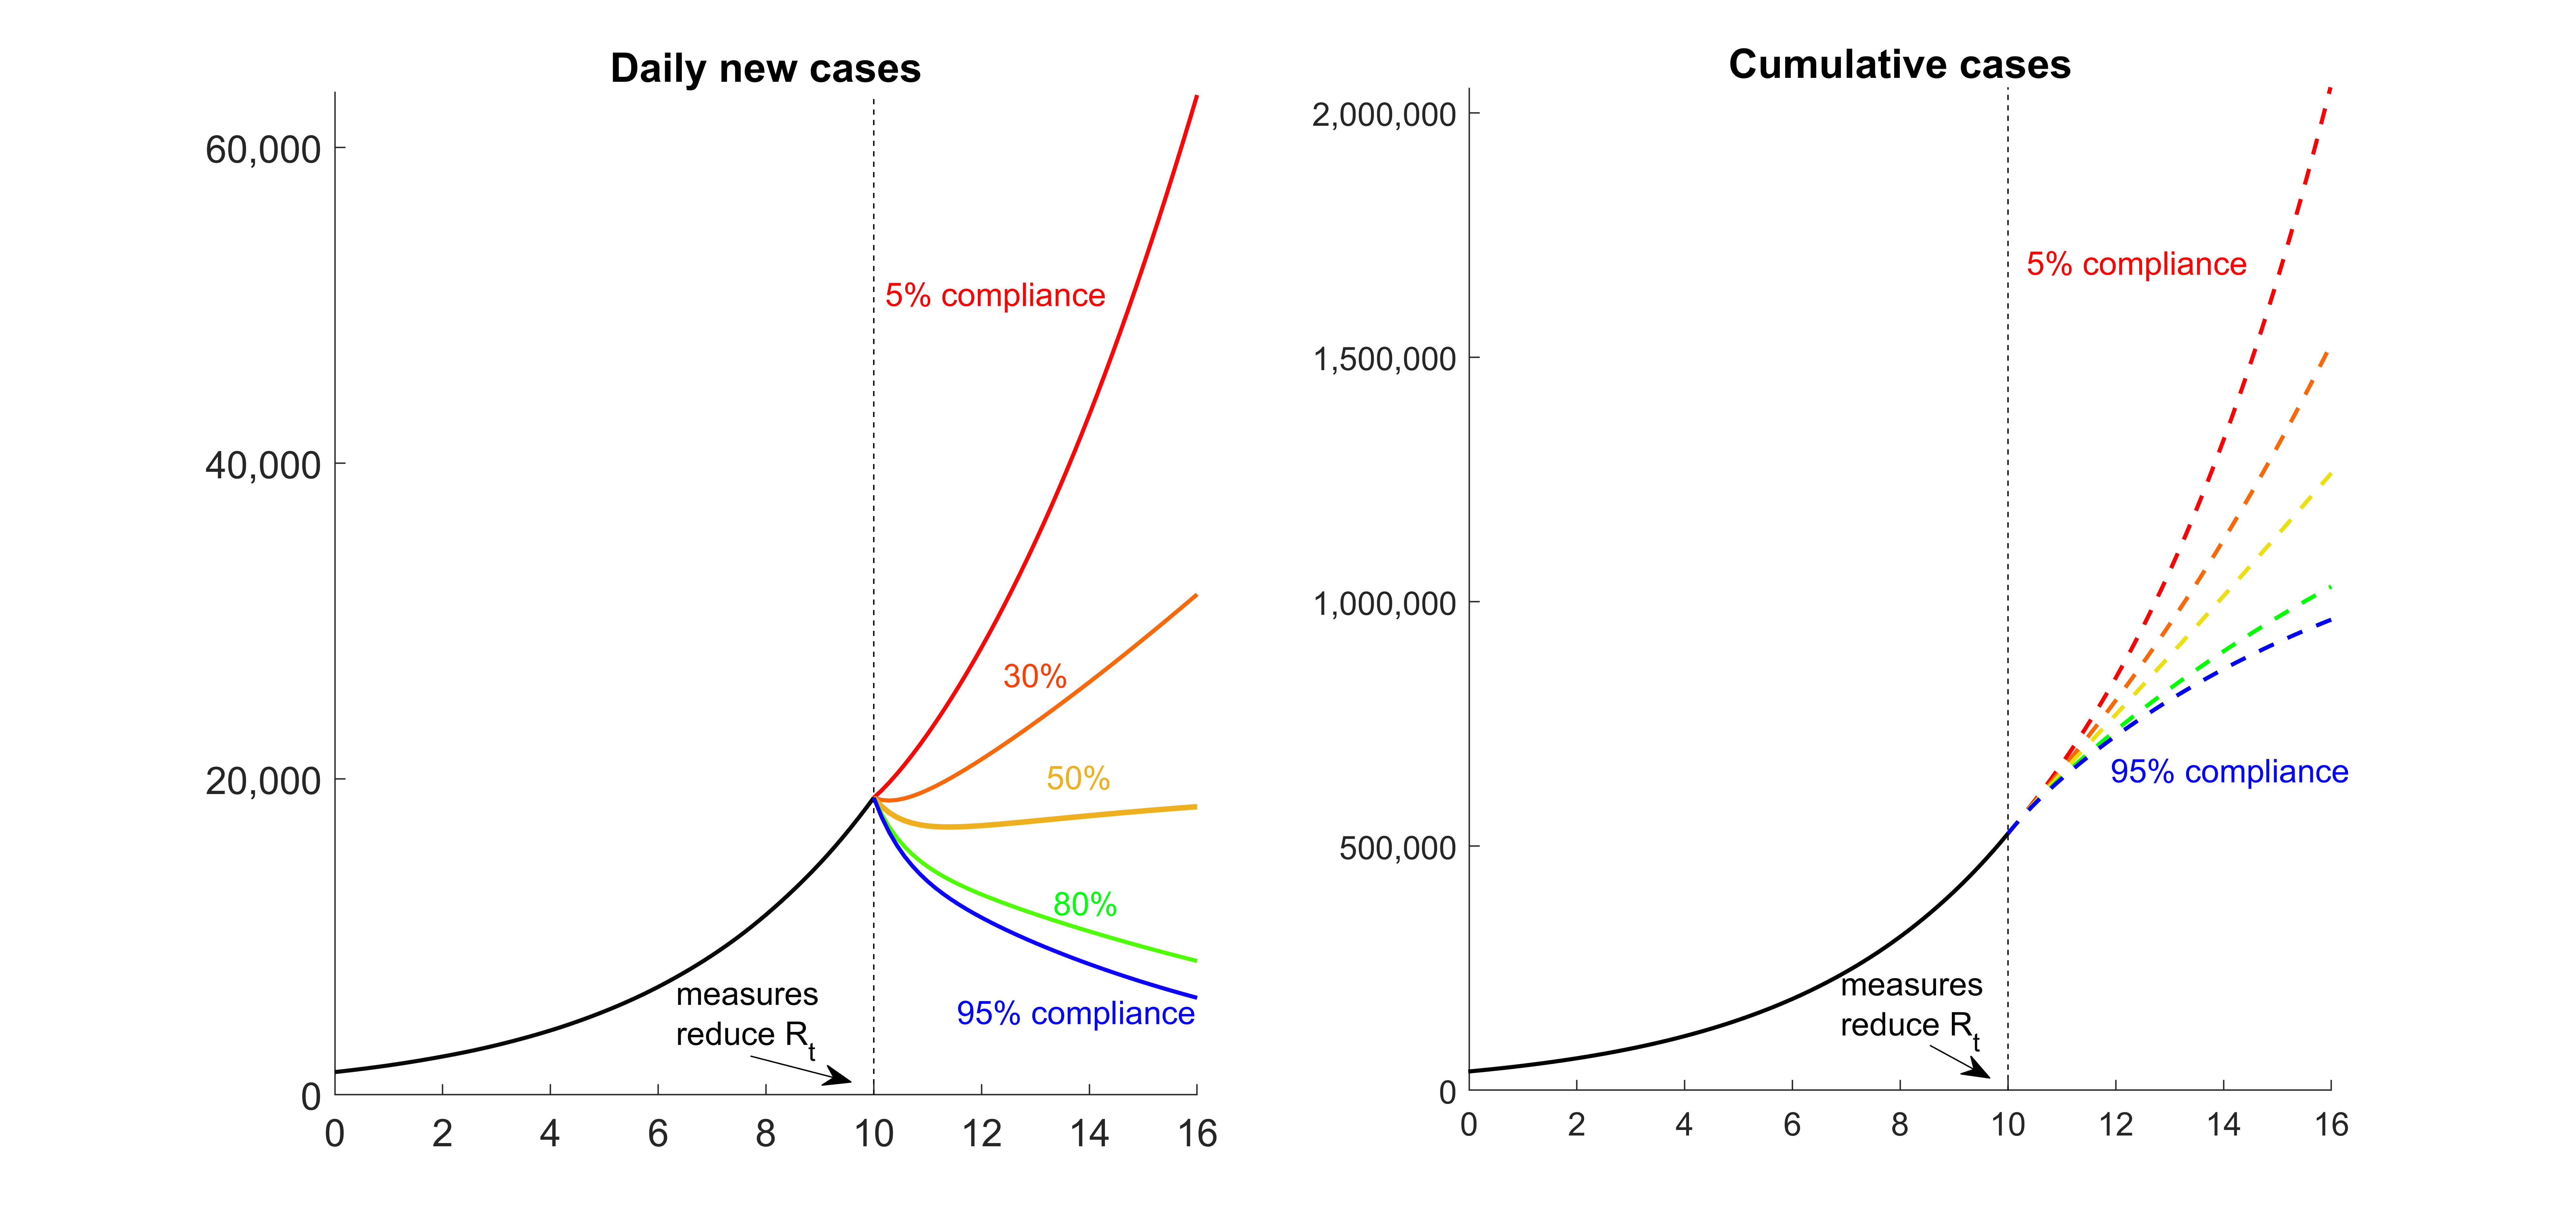
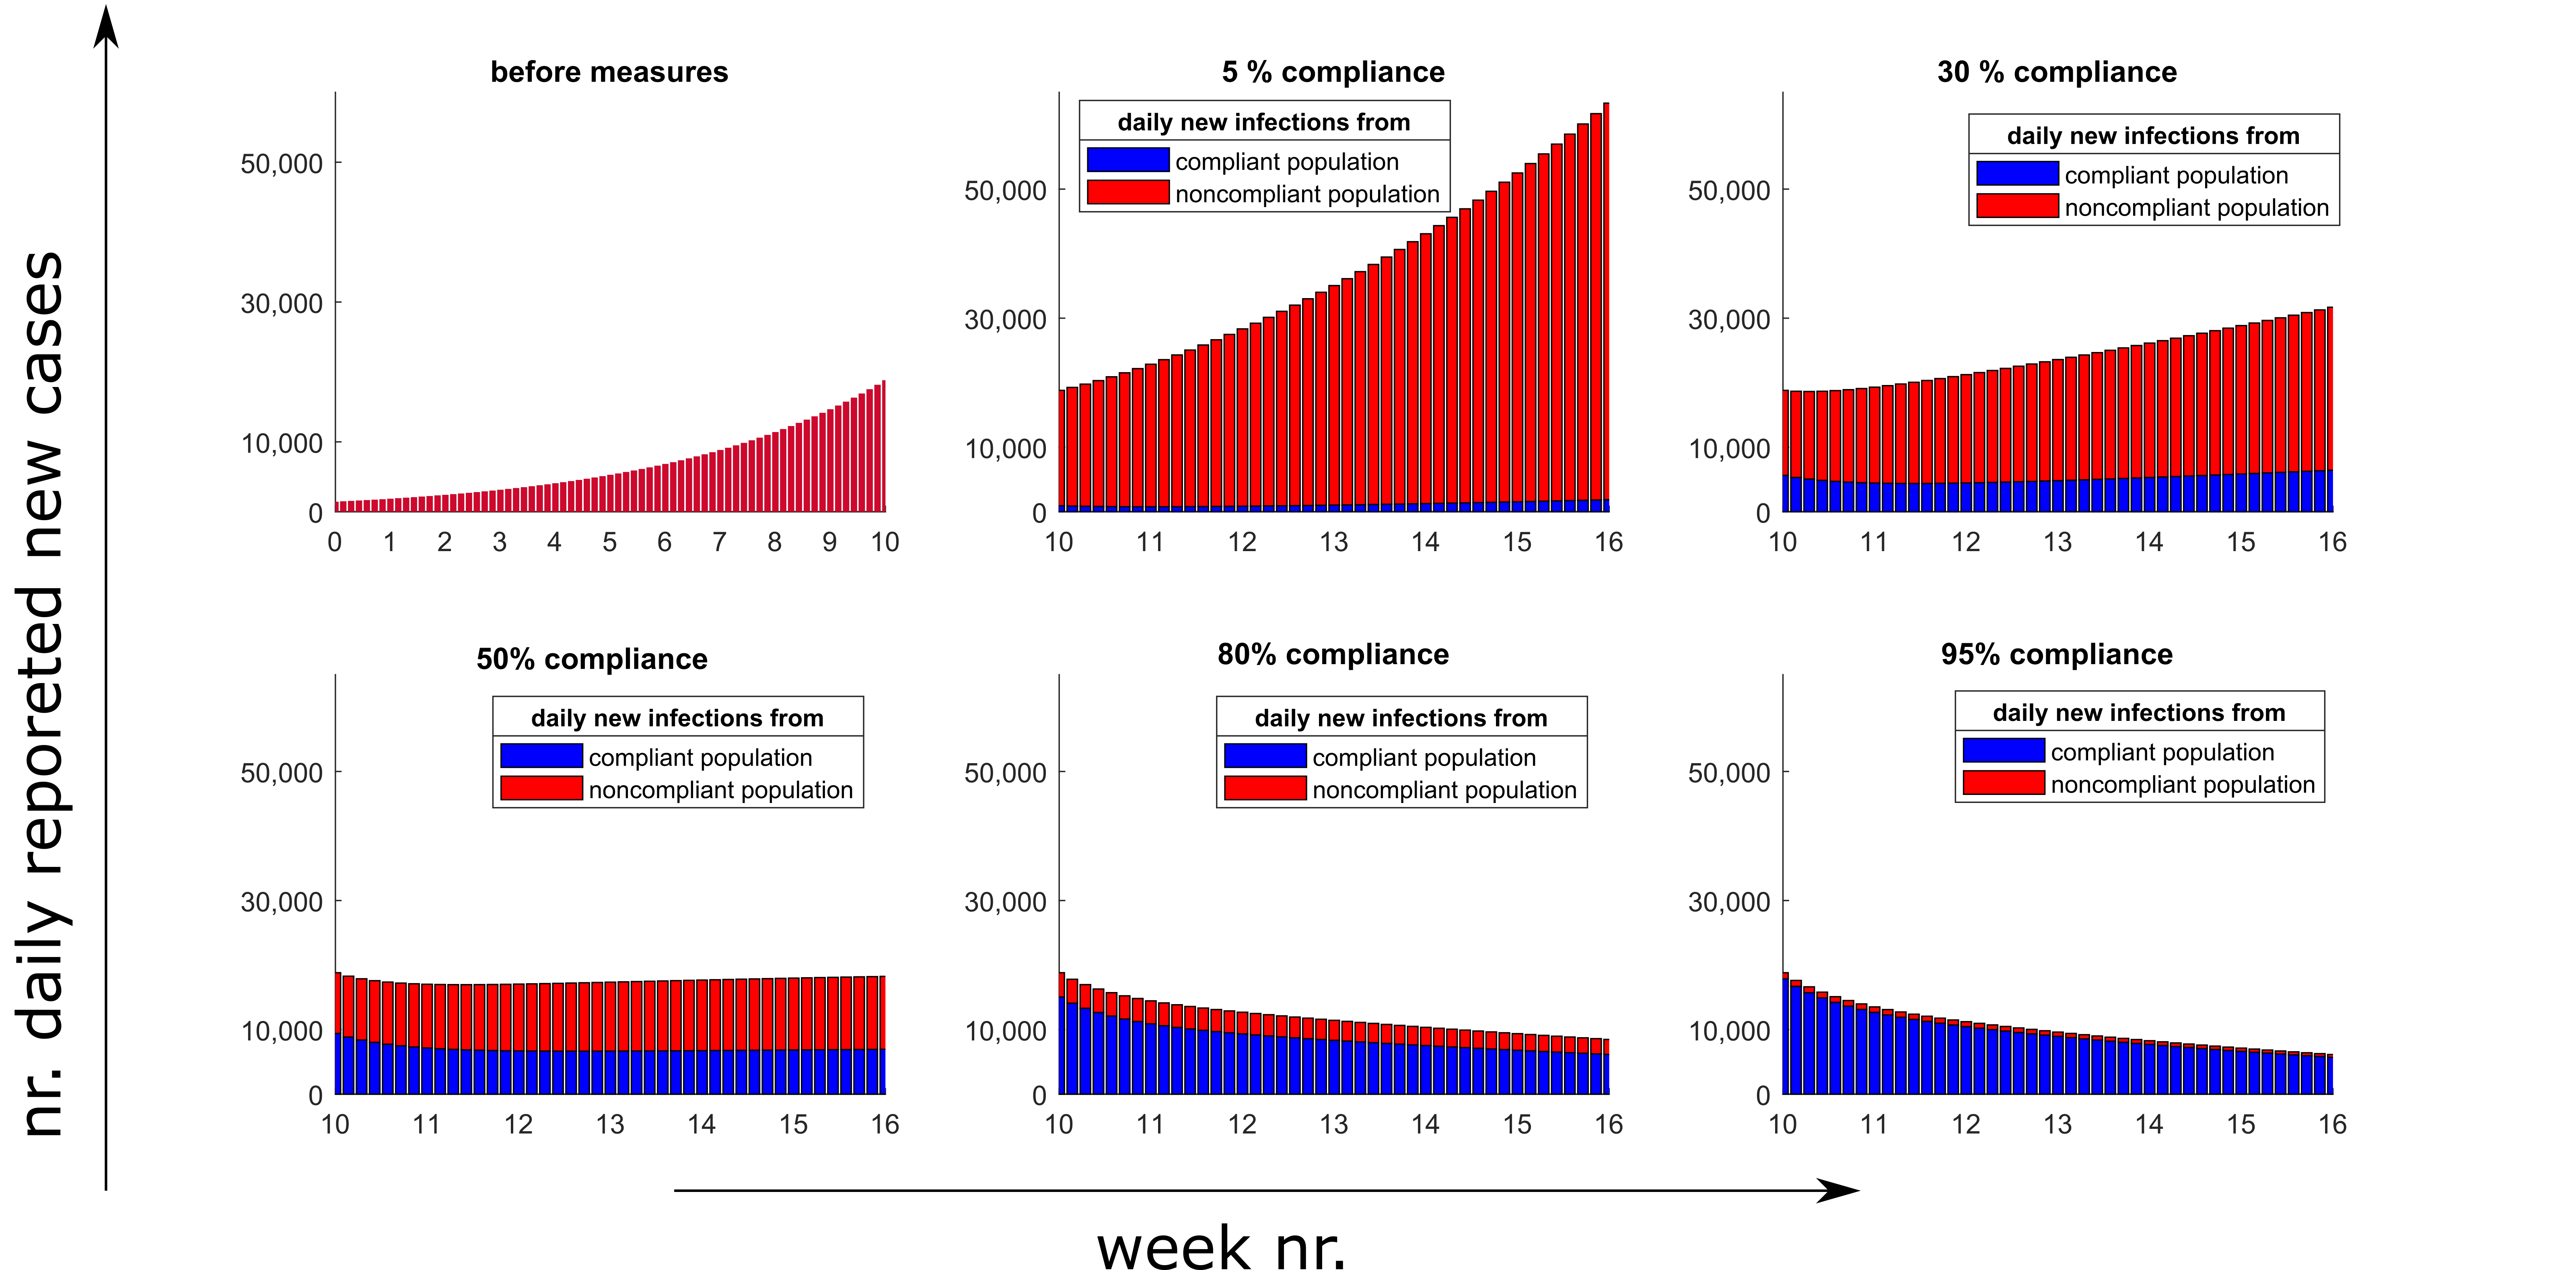
Figure 1 shows new cases as well as cumulative cases in the different scenarios. Figure 2 shows in 6 panels the number of new cases for different compliant fractions, a distinction being made as to whether the newly infected had previously followed the specified rules ("compliant") or not ("non compliant"). We assume that all detected positive cases behave as compliant and isolate themselves.

Figure 1: Daily new cases and cumulative cases vs. number of weeks, before and after interventions. From week 10 on, control measures reduce the reproduction number from 1.5 to a lowest possible value of 0.75, assuming contacts are uniformly reduced in the population. If only a certain percentage of the population complies with contact reduction, the control measures might fail to contain the epidemic. When control measures begin to reduce the reproduction number Rt we assume about 20,000 detected cases per day and about 520,000 cumulative cases detected since the beginning of the epidemic, a situation which mimics the German data in October 2020.

Figure 2: Daily new cases before (upper left) and after introduction of control measures (week 10), assuming 5% to 95% compliance in contact reduction. New infected individuals might have been compliant (blue) or noncompliant (red) before being infected.
The simulations show that in the case of 50% compliance, the introduction of the measures leads to a plateau, which was actually seen in the reported data from November 2020 in Germany. This does not imply that 50% of the population did not adhere to the measures. Very similar images can be generated under different assumptions, e.g. different detection and stricter / milder measures with a lower / higher proportion of the population adhering to the measures. In reality, different people most probably adhere to individual rules to different degrees rather than being either fully compliant or not compliant at all. Qualitatively, the images remain similar under these different assumptions, and the obvious message is that the more people reduced their contacts, the faster you could achieve the control of the outbreak. If, on the other hand, many people can and do not participate, the efforts of the others remain fruitless for a long time.
A Text by Dr. Maria Barbarossa and Dr. Jan Fuhrmann
Background
Maria Barbarossa’s research group at FIAS in collaboration with colleagues at Julich Supercomputing Center is working since March 2020 at mathematical models for the spread and control of COVID-19 in Germany. As part of this collaboration, the SimLab "Epidemiology & Pandemics" (Dr. Jan Fuhrmann) has been established at JSC in summer 2020. The models in their most complex form include age groups, different levels of infectiousness and disease severity (e.g. patients requiring intensive care), and were used among others
- to predict the effect of nonpharmaceutical intervention during the first COVID-19 wave
- to highlight the importance of the assertion ratio (that is, how many cases we detected over the total amount of infected people)
- to explain the effect of panic behavior just before strict measures (lockdown) are implemented
- to predict the outcome of short time lockdowns and to propose possible control strategies on the emerging second wave in the autumn of 2020. This result turned out to be confirmed also from case/death counts of several countries like France and Ireland which experience a second strict lockdown period in the fall and subsequently a new increase in cases shortly after lifting the lockdown measures.
https://www.medrxiv.org/content/10.1101/2020.04.08.20056630v1
https://journals.plos.org/plosone/article?id=10.1371/journal.pone.0238559
https://archpublichealth.biomedcentral.com/articles/10.1186/s13690-020-00445-8
https://www.researchsquare.com/article/rs-82993/v1
https://onlinelibrary.wiley.com/doi/epdf/10.1111/irv.12827
The group contributes also with weekly short-term predictions to the German and Polish Forecast Hub established at KIT (https://kitmetricslab.github.io/forecasthub/forecast ,
https://www.medrxiv.org/content/10.1101/2020.12.24.20248826v1 ).
Contact
Dr. Maria Barbarossa barbarossa_at_fias.uni-frankfurt.de
